Learn QV Core in the same order you use it: understand the chart, identify a level, wait for price, confirm the reaction, execute with a plan, and manage risk.
01 · What is QV Core?
QV Core shows you trading opportunities directly on your chart.
Markets move through countless price levels every day. The challenge is not finding more levels; it is knowing where to focus, which areas matter more, and where a trading opportunity may develop.
QV Core is a TradingView trading system that identifies dynamic market levels, displays their relative strength, and helps you identify potential Buy and Sell opportunities directly on your chart. Built from years of trading experience, it brings a structured trading approach into a practical tool you can use on TradingView.
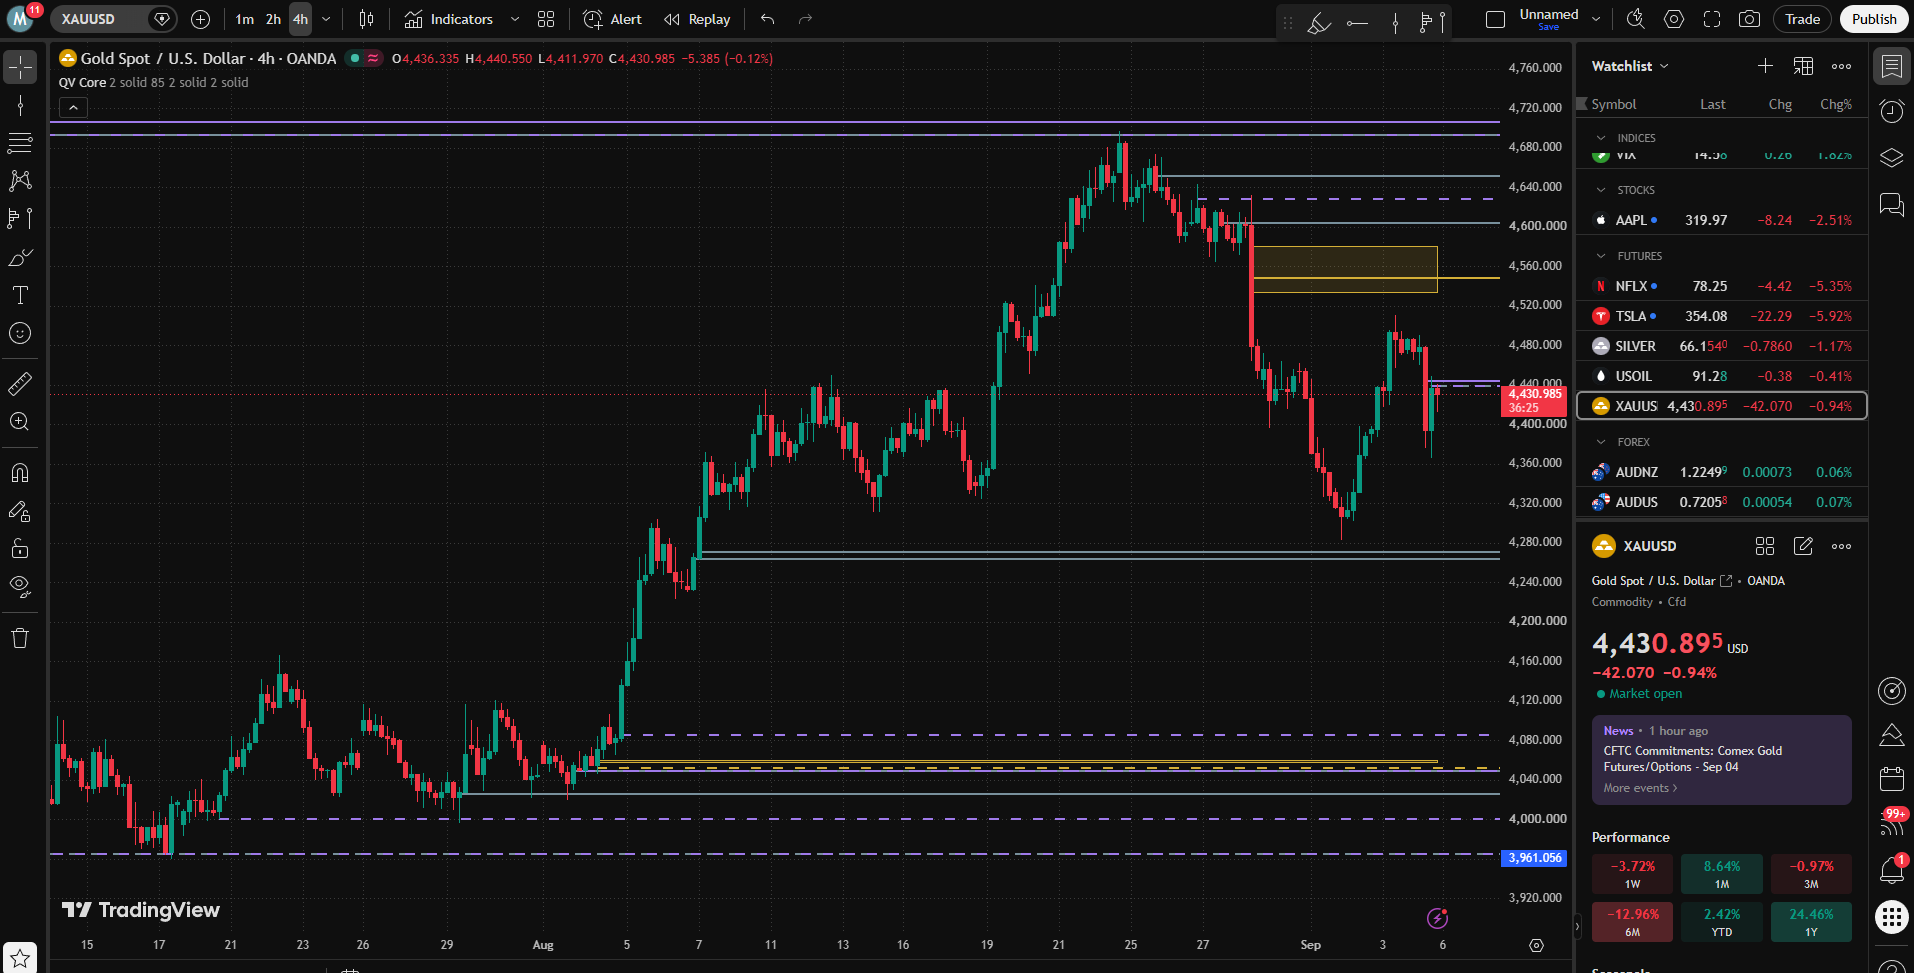
Each level is displayed with a strength percentage, giving you an immediate way to compare significance and prioritize the areas that deserve closer attention.
The result is a clearer trading view:
Where is the opportunity? Which levels matter more? What should you watch when price reaches them?
Buy · Sell · Wait · No Trade
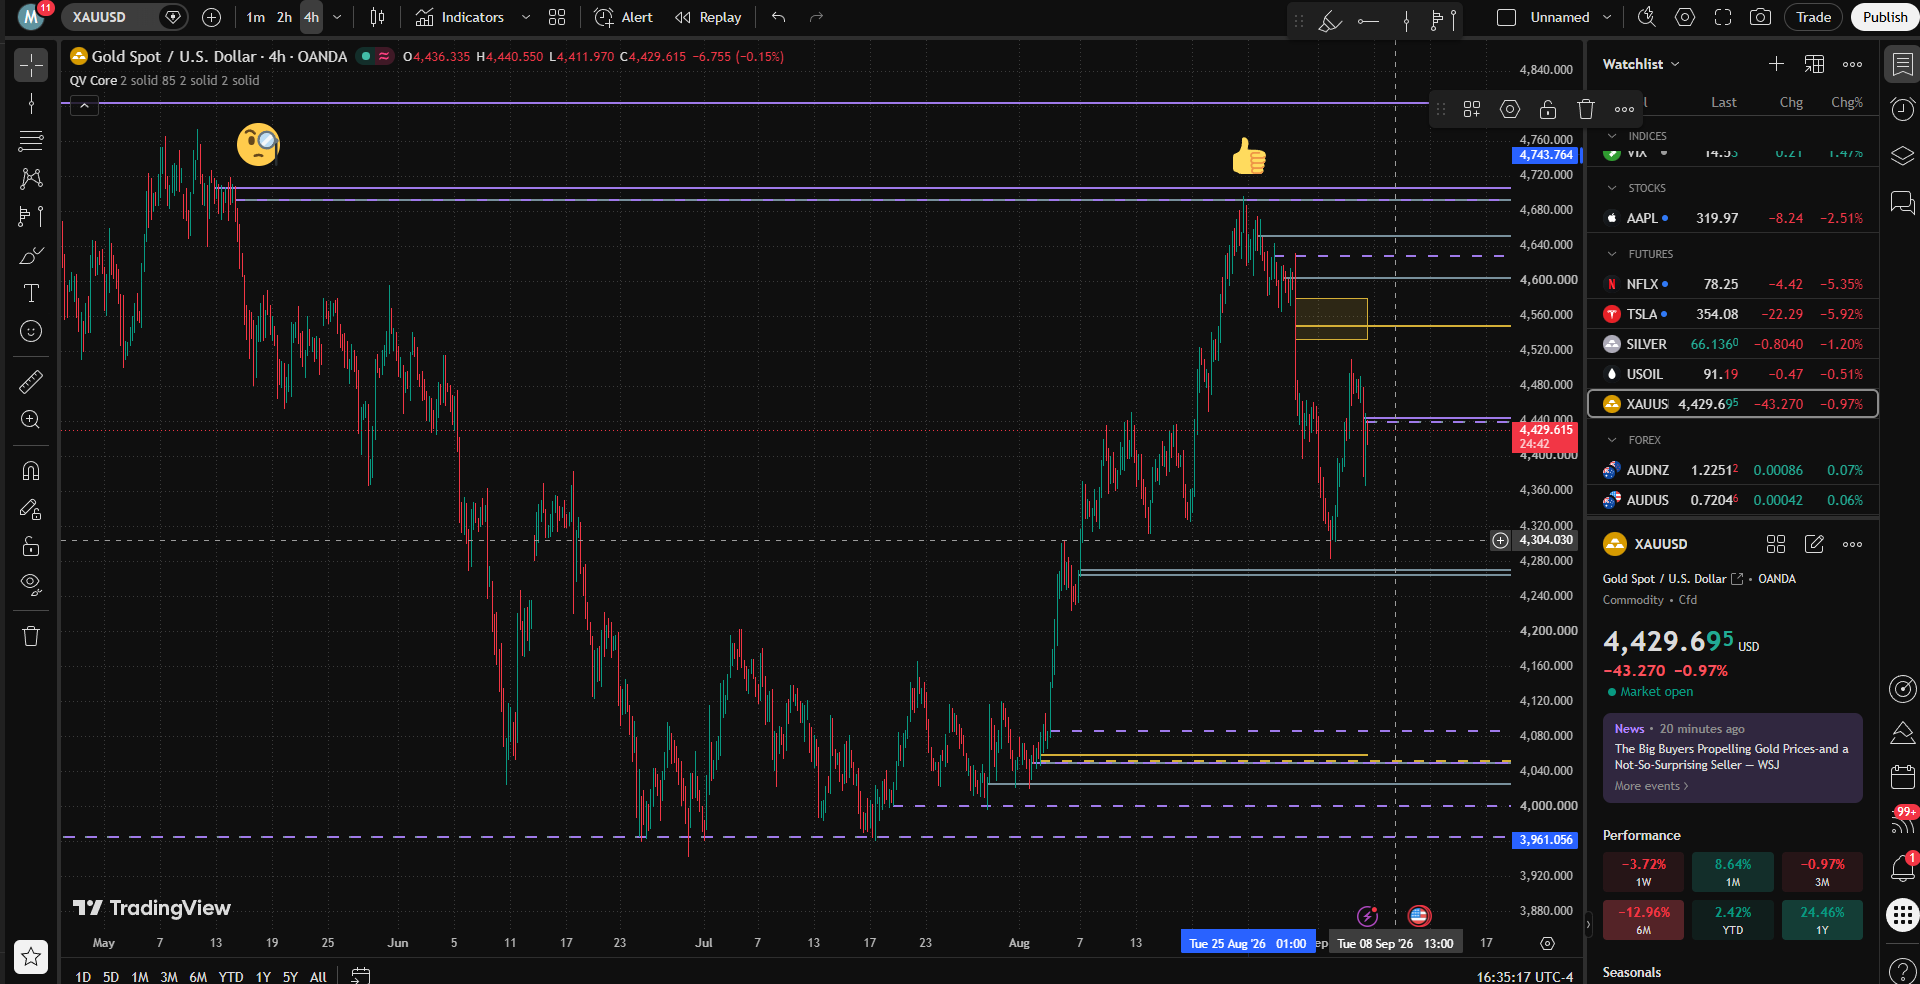
XAUUSD four-hour chart showing QV Core levels in gold, purple and silver.
What does QV Core identify?
QV Core identifies dynamic market levels and displays their relative strength directly on your chart. A level is not simply another line. It is an area that deserves attention because it can become the location for a trading opportunity.
Each level carries a strength percentage that helps you compare relative significance and prioritize your analysis. When price returns, the level becomes an opportunity area to evaluate. Price can react, reject, pause, accelerate, continue, or break.
QV Core identifies the opportunity area. Price confirms what happens next.
From levels to trading opportunities
QV Core helps you identify where a potential Buy or Sell opportunity may develop. The level and its strength show you where to focus; the retest and reaction provide the evidence; confirmation and risk management help you decide what to do next.
The possible decision is not always an entry. Depending on the evidence, the right action may be Buy, Sell, Wait, or No Trade.
You still need to evaluate candle behavior, timeframe confirmation, invalidation, target, position size, and risk before executing.
More than traditional support and resistance: Traditional S/R asks, “Where is support or resistance?” QV Core asks, “Where does price matter, how significant is the area, and what should I watch for when price returns?”
These definitions are used throughout every QV Core workflow.
Level and formation
Level: a dynamic price area identified by QV Core as potentially important for a trading opportunity. Level formation: the moment a new level appears on the chart. Level maturity: the stage after price has moved away from a newly formed level, making a later retest meaningful.
Formation is not entry. A newly formed level is an area to monitor, not an immediate trading opportunity. Wait for price to move away and return before evaluating a setup.
Retest and reaction
Retest: price returning to a level after moving away from it. Reaction: the way price behaves at the level, such as creating a wick and closing without invalidating the area.
Level strength
By colour, the strength order is generally Gold, then Purple, then Silver. Dashed levels generally carry more strength than Solid levels. Several nearby or overlapping levels identify a more important area.
Strength is significance, not direction. A stronger level does not automatically mean Buy or Sell. It means the area deserves greater attention within the QV Core framework.
Invalidation and reference line
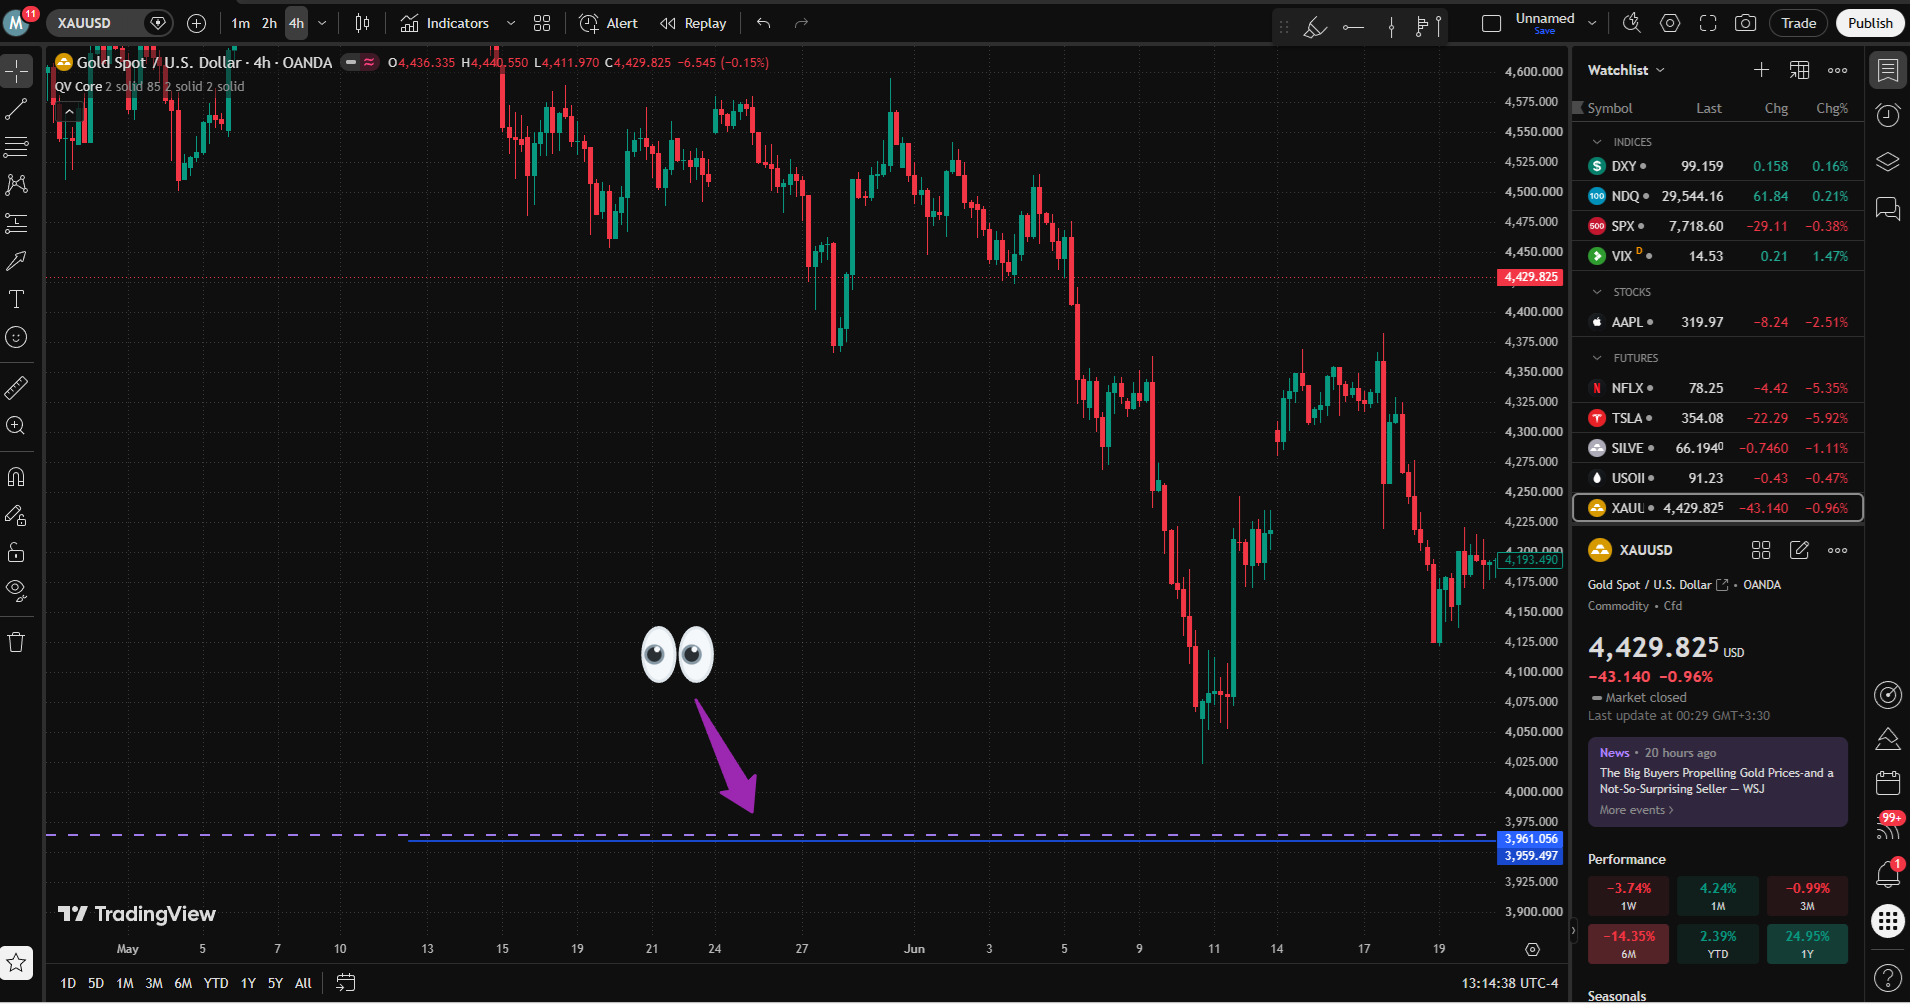
Invalidation: price behavior that makes the level no longer valid, such as a clear close through the invalid side. Reference line: a manual blue line used to compare the same price area on another timeframe.
Additional terms: A Higher Timeframe provides a broader market view. A Lower Timeframe can provide confirmation or execution detail. Confluence means that independent observations support a similar price area.
A line is not the end of the analysis. It is the beginning of a structured process.
The QV Core principle: QV Core shows you where price matters and where a trading opportunity may develop. Your job is to evaluate the setup before executing the trade. Do not trade the line; trade the reaction around the level.
1. Identify
Find the active level and assess its colour, line style, timeframe, and relationship to nearby levels.
2. Wait
Allow price to move away from the level. A newly formed level is not treated as an immediate entry.
3. Confirm
When price returns, study the wick, candle close, and any confirmation from another timeframe.
4. Plan
Define the entry, invalidation, stop-loss, target, and position size. If the evidence is incomplete, do not trade.
Trading method 1
Single-timeframe: any timeframe
This method can be used on any timeframe. The example below uses 4H, but the context, reaction, and trade decision are all evaluated on the same chart.
Opportunity area = the chosen timeframe
Use your chosen timeframe to identify the active level and assess its strength. Allow price to move away before considering a later retest.
Confirmation and execution = the same timeframe
Wait for the retest and evaluate the reaction. If the candle that touches the level with its wick closes without invalidating it, the stop-loss can be placed beyond that candle's wick according to your risk plan.
Method flow: Level → price moves away → retest → reaction → stop-loss can be placed beyond the reaction candle's wick → entry plan.
Your first QV Core workflow: Choose this method, identify the level, wait for the retest, evaluate the reaction, define invalidation and risk, then execute only if the setup fits your plan.
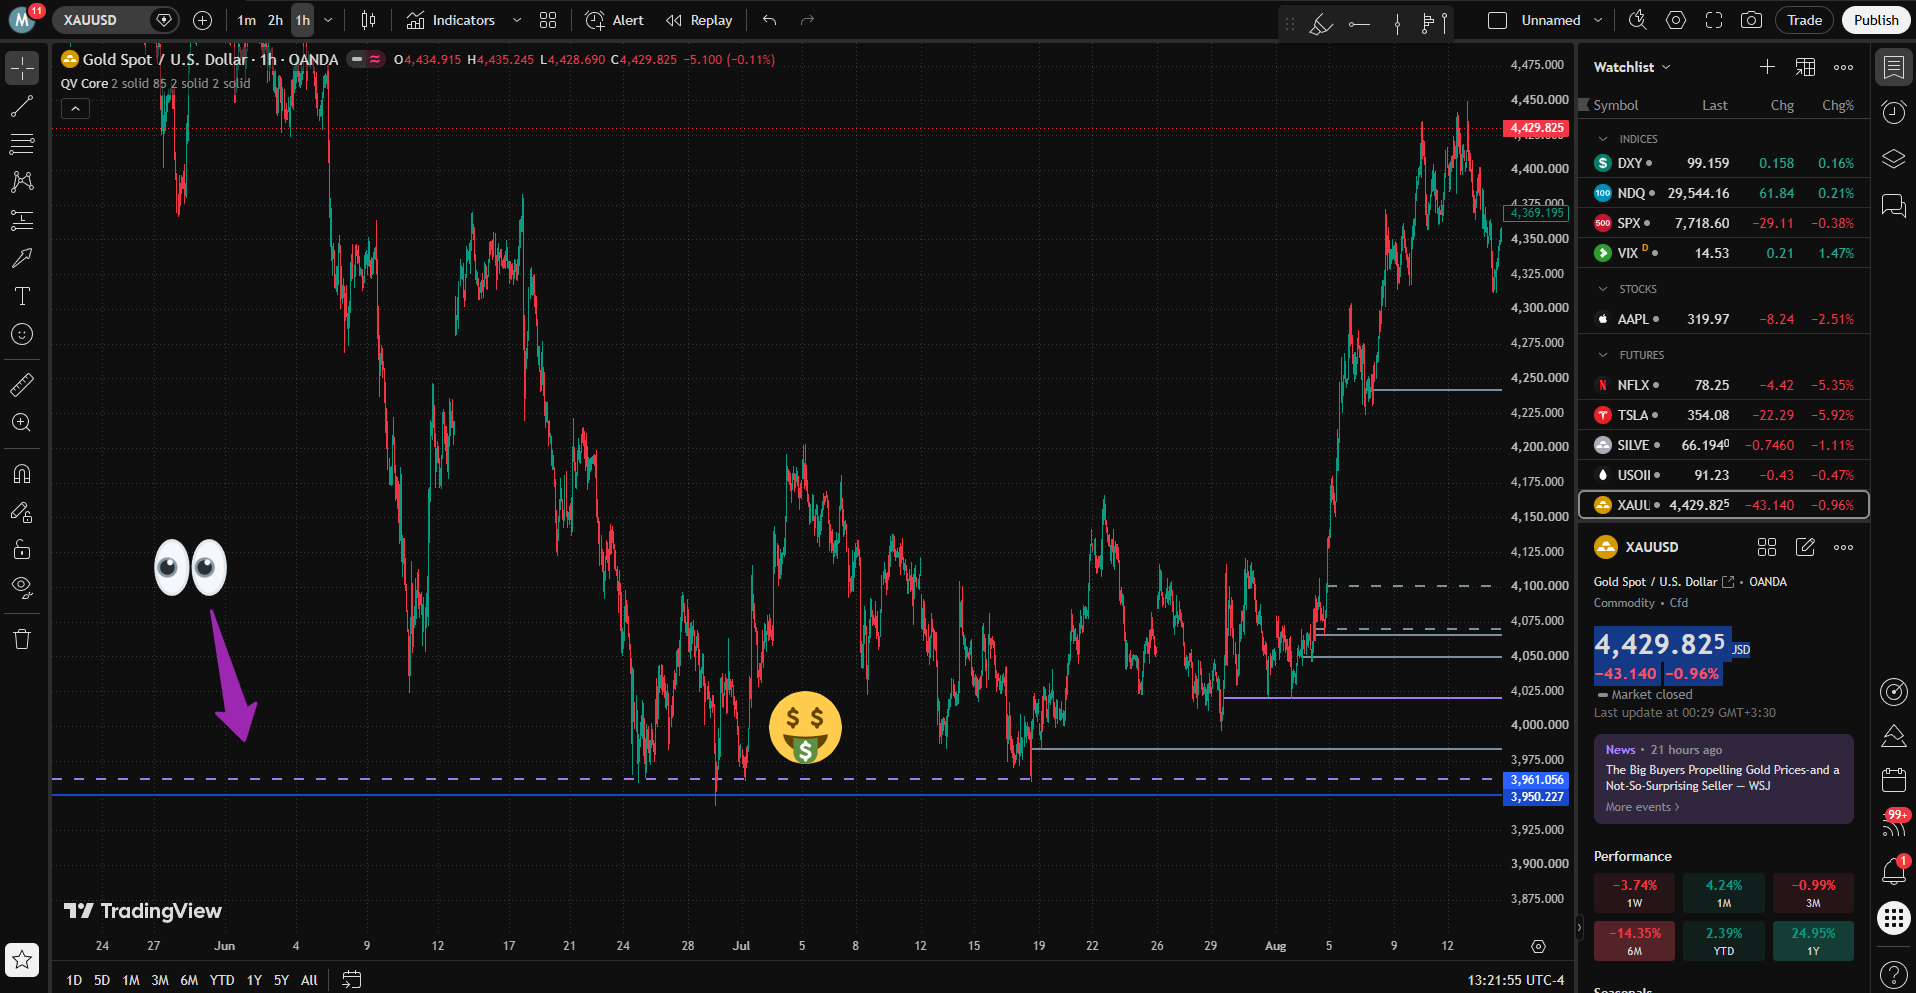
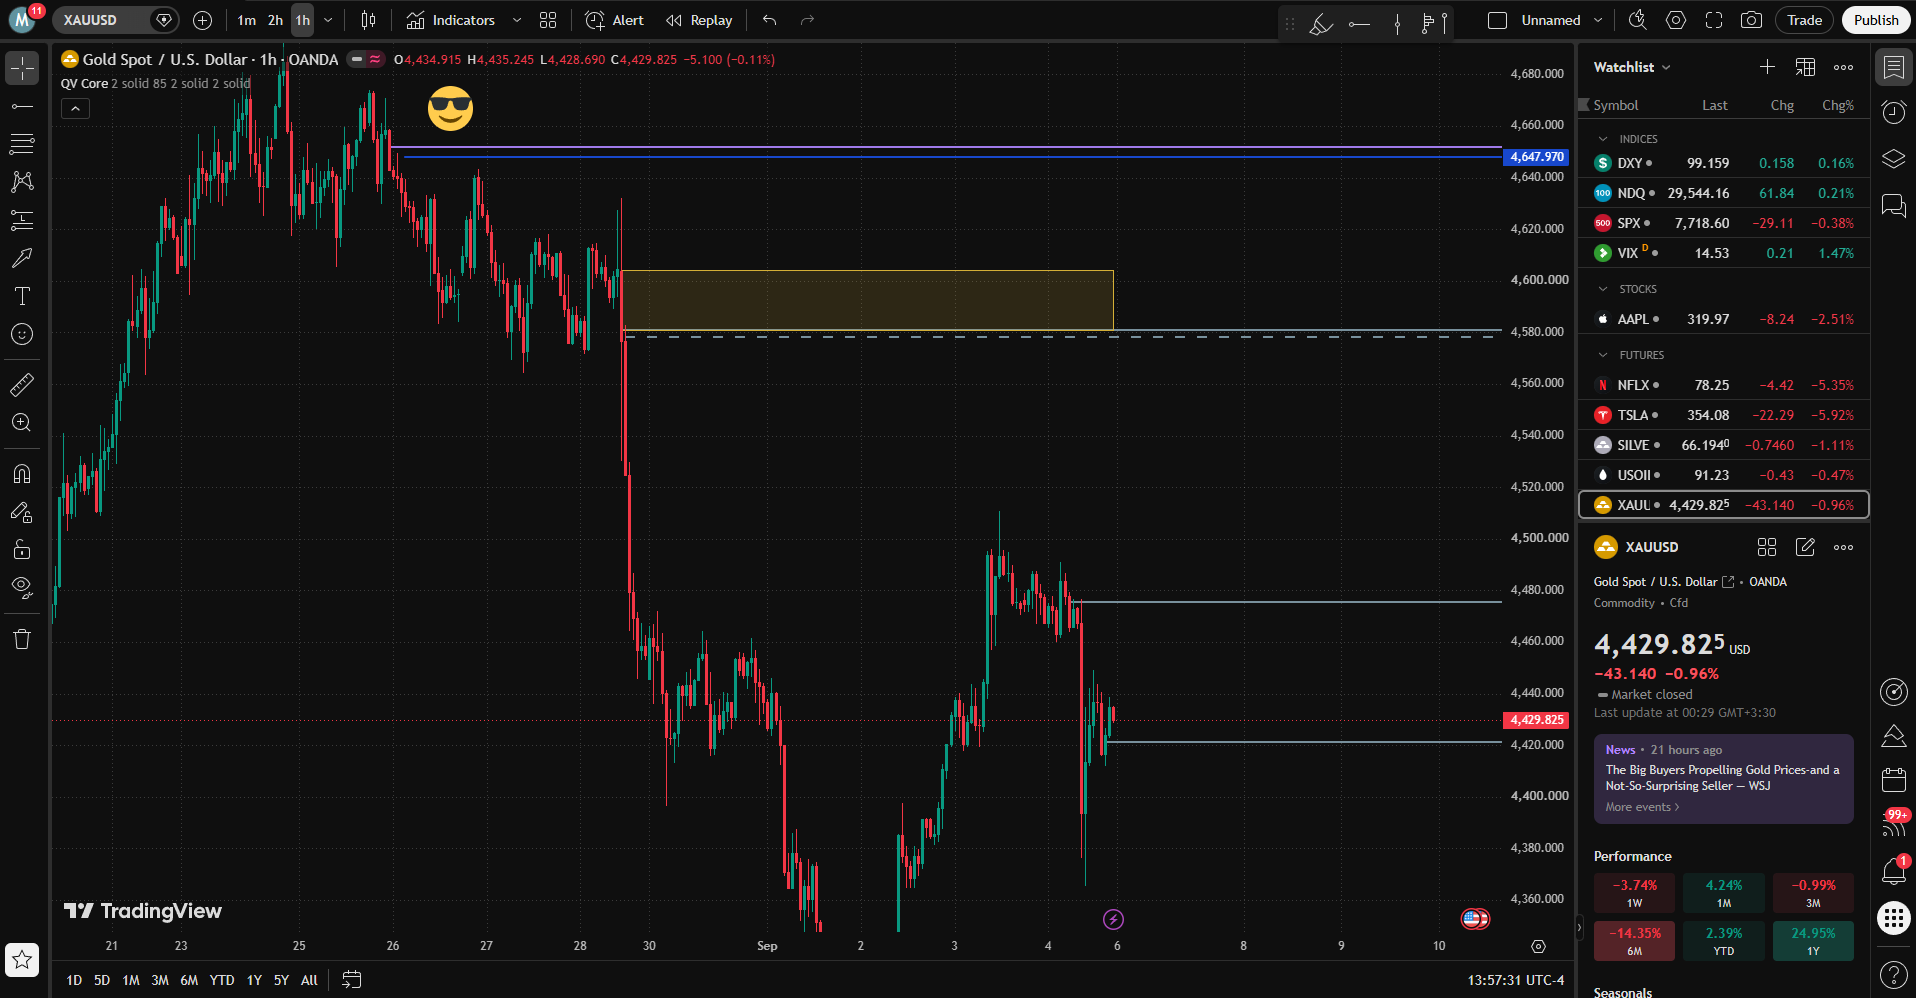
Here, the 4H chart identifies the opportunity area and the 1H chart provides confirmation.
4H = Opportunity Area
The 4H chart identifies the important market area. Mark the level and draw a blue reference line beside it.
1H = Confirmation
Use the 1H chart to check whether QV Core shows a level at the same price area. 1H Reaction = Evidence for Execution. Evaluate the reaction before building the trade plan.
Practical rule: Two matching timeframe observations are often enough to begin watching the area closely. Confirmation supports the decision; it does not guarantee the outcome.
Ready to practice 4H → 1H confirmation? Start your 7-day free trial and test the workflow on your own charts. Start 7-Day Free Trial →
Trading method 3
Higher timeframe → execution timeframe: 1H → 5M
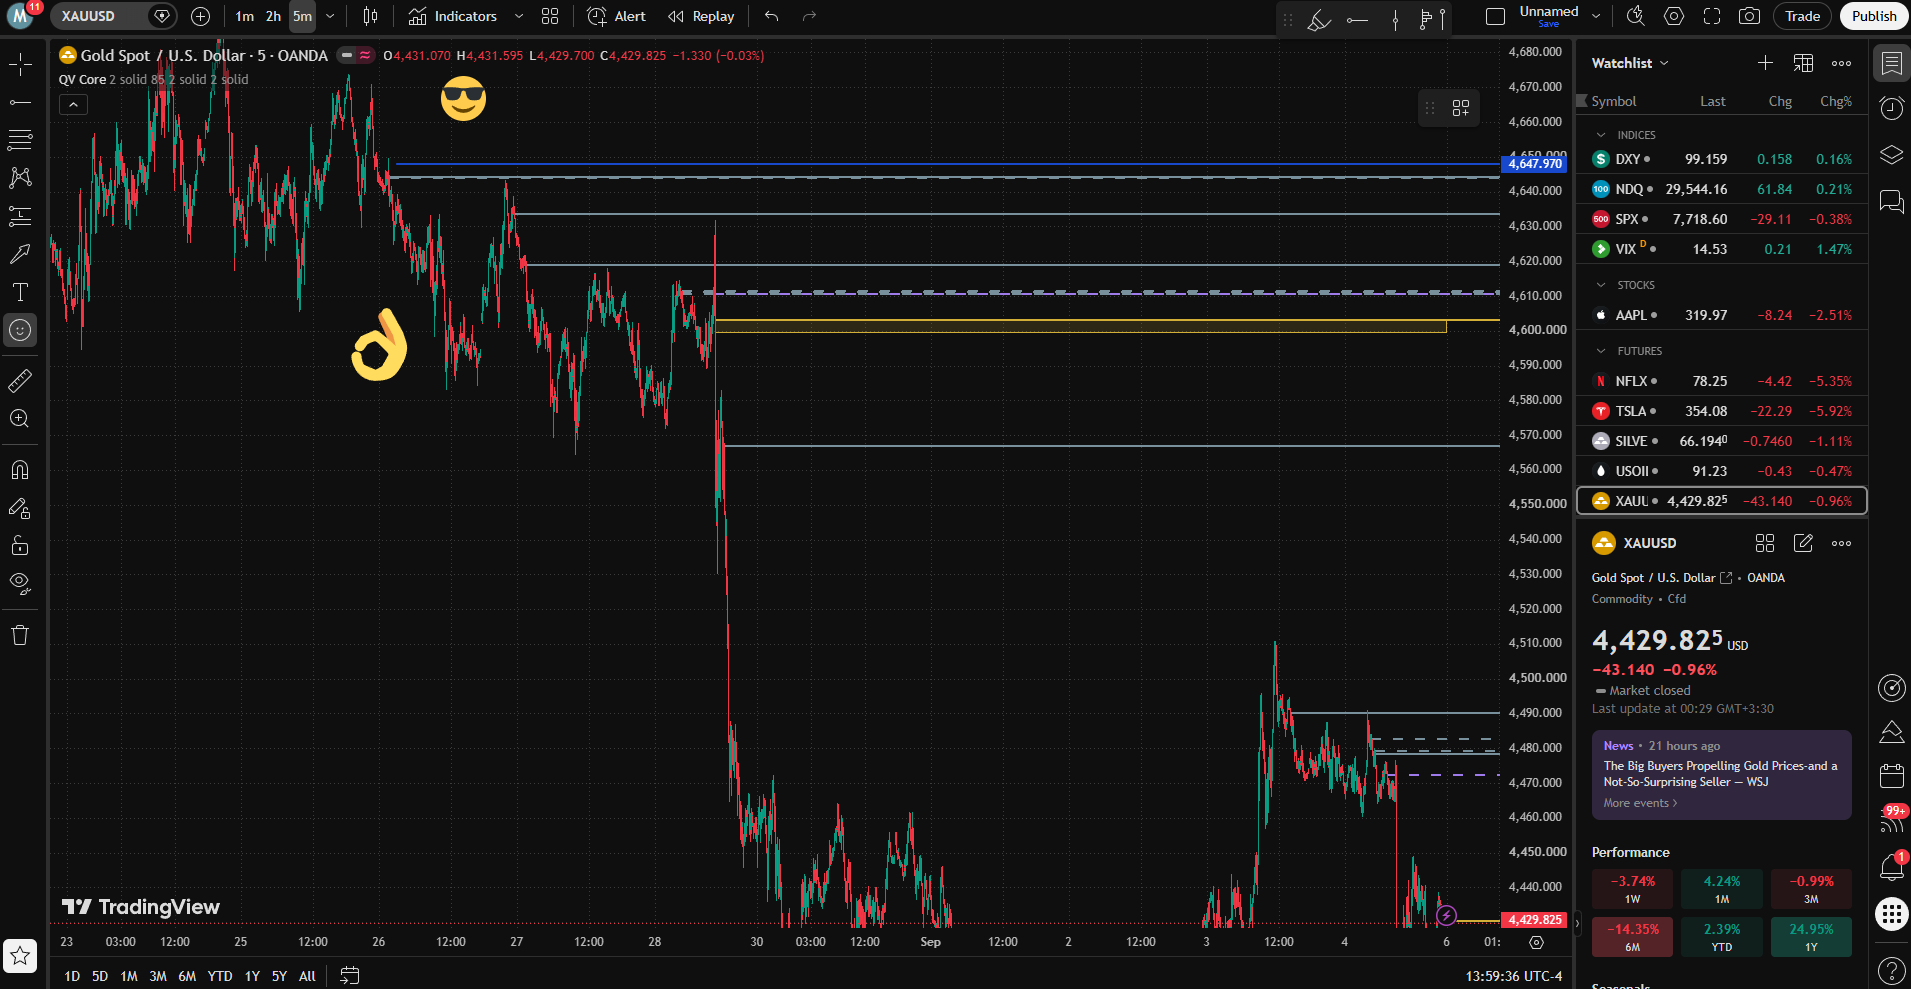
The 1H chart identifies the important area, while the 5M chart helps refine the execution.
Opportunity area and reaction = 1H
The 1H chart identifies the important area. Wait for price to return, create a wick, and close without invalidating the level.
Execution = 5M
After the 1H reaction, move to 5M. Check for an existing level or a newly formed level in the same area. Both together represent stronger confirmation.
Method flow: 1H level → price moves away → 1H reaction → move to 5M → 5M level or new level → execution plan.
Keep perspective: Lower timeframes may offer more opportunities, but they also contain more noise. More precise execution should not become a reason to increase risk without a plan.
Ready to practice 1H → 5M execution? Start your 7-day free trial and refine the process on your own charts. Start 7-Day Free Trial →
05 · Confluence
Multi-timeframe confluence
Confluence means that independent observations support a similar price area. It does not simply mean that more lines are always better.
4H + 1H + 5M
The 4H chart identifies the opportunity area, the 1H chart provides confirmation, and the 5M chart can refine execution. Each timeframe should have a clear role.
Evidence, not certainty
Confluence can make an area more worthy of attention, but a trade still requires a valid reaction, a defined invalidation point, and controlled risk.
06 · Trade examples
See the process on the chart.
These case studies connect the concepts and methods to a practical decision sequence. The examples are educational and do not guarantee a trading result.
Example 1 · Single-timeframe long
4H → 4H
One chart provides the level, the reaction, and the execution decision.
A wick followed by a close that does not invalidate the level is confirmation evidence, not a complete setup by itself.
Build the plan
Define the entry, consider placing the stop-loss beyond the reaction wick according to your rules, set a realistic target, and decide how much of your account you are willing to risk.
Example 2 · Higher-timeframe confirmation
4H → 1H long
The higher timeframe identifies the area; the lower timeframe checks whether the same area is supported.
4H: mark the reference area.1H: confirm the same price area.
014H LevelMark the relevant level.
↓
02Price Moves AwayLet the new level mature.
↓
034H RetestWait for price to return.
↓
04Open 1HUse the blue reference line.
↓
051H Level at Same AreaCheck for a matching QV Core level.
↓
061H ReactionEvaluate the wick and close.
↓
07Trade PlanDefine entry, stop-loss, target, and risk.
What matters: The confirming line does not need to have the same colour. It needs to exist in the same price area.
Example 3 · Lower-timeframe execution
1H → 5M long
The 1H chart defines the opportunity; the 5M chart helps refine execution.
1H: define the opportunity.5M: refine the execution.
011H LevelDefine the opportunity.
↓
021H ReactionEvaluate the reaction, including the candle close.
↓
03Move to 5MRefine execution.
↓
045M LevelLook for an existing or new level.
↓
05ExecutionEnter only if the plan fits.
Opportunity area and reaction = 1H
Identify and mark the 1H level. Wait for price to return and evaluate the reaction, including the wick and candle close.
Execution = 5M
On 5M, look for an existing level or a newly formed level in the same area. If both appear, the additional evidence is stronger, but it is still not a guarantee.
Example 4 · Confluence
4H + 1H + 5M
Several independent observations point to a similar price area.
4H → opportunity area
The 4H chart identifies the major opportunity area and gives the trade a broader market perspective.
1H → confirmation
The 1H chart supports the area.
5M → execution
The 5M chart may provide an additional level or a new formation for execution.
Confluence is not about collecting lines. It is about independent evidence: 4H provides context, 1H provides confirmation, and 5M refines execution.
Confluence increases supporting evidence, not certainty. More lines do not equal an automatic trade. Each timeframe should provide an independent observation, followed by a valid reaction and a controlled plan.
Example 5
No trade
QV Core may show a level while the conditions for a trade are still incomplete.
When we do not enter
Price has not moved away from the level, no meaningful retest has occurred, the wick or candle close is unclear, timeframe confirmation is missing, or the risk is not acceptable.
A professional decision
A level is not the same as a trade. Waiting or passing on the opportunity is part of the QV Core process and protects the quality of your analysis.
Ready to practice the workflow? Start your 7-day free trial and test the process on your own charts.
Start 7-Day Free Trial →
07 · Risk management
Define the risk before the entry.
QV Core identifies the area; the trader remains responsible for position size, risk, and execution.
Invalidation and stop-loss placement
Define what price behavior would invalidate the level. The stop-loss can be based on the market structure and reaction wick, rather than an arbitrary distance.
Position sizing
Position size should be consistent with the stop-loss distance and the maximum risk allowed on the account.
Simple example: If your maximum risk is $30 and the stop-loss distance requires $0.10 per unit, calculate the position size from the $30 risk limit and the stop-loss distance. Do not choose the position size first and justify it later.
Risk/reward and no trade
Before entering, define the target, exit conditions, and risk/reward profile. If the opportunity does not fit your plan, do not trade.
Risk disclaimer: Trading involves risk. QV Core is a trading tool, not financial advice or a guarantee of results.
08 · TradingView setup
Build a workspace for the process.
Add QV Core to your chart, select the symbol and timeframe, and use a manual reference line when comparing timeframes. A simple workspace can include the opportunity-area chart, confirmation chart, and execution chart.
Add the indicator and change timeframe
Open the opportunity-area timeframe first, then move to the confirmation or execution timeframe when the workflow requires it.
Use a reference line for MTF analysis
Draw a blue line beside the reference level so you can locate the same price area on another timeframe. The blue line is only a visual guide.
09 · Quick reference
The QV Core checklist
Understand → identify → wait
What is QV Core showing? Where is the level? Has price moved away from it?
Confirm → execute → manage
Is the reaction valid? Is the required confirmation present? Are the entry, stop-loss, target, and risk defined?
Key principle: QV Core identifies where trading opportunities may develop and shows where price matters. The trader decides with patience, confirmation, and risk management.
You now know the process. Identify the level. Wait for price. Confirm the reaction. Build the plan. Manage the risk. Start 7-Day Free Trial →
One momentPlease wait while the next page is loading.